Markets in a Minute - September 14, 2021 | Pacific Wealth Planning
Even with its September slump, the equity market has staged a remarkable comeback from its pandemic lows. But, with equity valuations near historic highs, many investors are asking: Is this as good as it gets? Not likely, given the momentum behind the U.S. economy and corporate earnings, though headwinds are likely to keep near-term returns muted.
While the economic recovery has lost some steam amid the latest surge in Covid cases, there’s still a tremendous amount of liquidity working its way through the economy, which provides a tailwind for growth and corporate earnings .
- The federal government’s initial response to the pandemic was notable for its scope and speed. Between the CARES Act and other relief packages, Congress authorized spending more than $3 trillion last year — equivalent to about 14.5% of U.S. GDP, and its largest spending package ever.
- In March 2020, the Federal Reserve slashed the Fed Funds Rate to near zero and enacted several programs designed to support a broad cross-section of markets. That emergency support went beyond even what was initiated during the Global Financial Crisis.
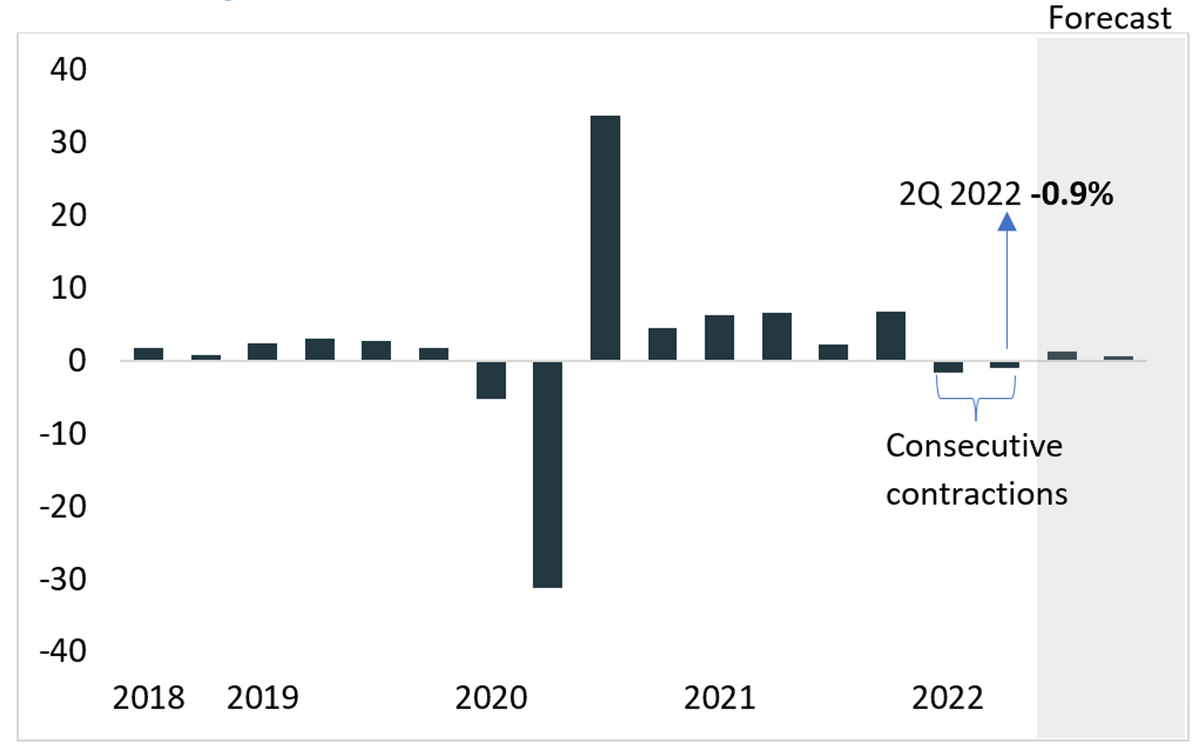
Corporate earnings are still rebounding, creating a favorable backdrop for equities.
- The earnings recovery in the first half of this year has been among the most-remarkable in modern financial history. Analysts began the year estimating that S&P 500 companies would earn $175 a share. Then by late August, analysts had revised expectations upward to more than $210 a share, an increase of 20%.
- 2022 expectations of corporate earnings currently stand at $225 and could prove low.
Record-high profit margins are helping to drive the earnings rebound and support valuations.
- Early in the pandemic, companies took steps to hold down expenses, such as freezing hiring and capital projects. As the economy rebounded and sales climbed, many have managed to keep expenses in check, resulting in record-high profit margins.
- According to the National Association for Business Economics’ Business Conditions Survey , the net number of panelists reporting rising profits is at its highest reading on record, despite higher input costs.
- According to FactSet, the S&P 500 reported its second-highest net profit margin since 2008, and improvement was experienced in every sector in the second quarter.
Are these high margins sustainable? What about tax increases?
- Thanks to globalization, technological advances, and lower taxes and interest rates, profit margins have been trending upward for two decades.
- Some of the forces that have pushed margins higher in recent years are secular trends that are likely to continue, such as automation and the use of technology.
- The biggest near-term risk to margins is higher taxes under the Biden administration. The latest proposal from Democrats suggests raising the top corporate rate to 26.5% from 21%.
- It’s worth noting that even at 26.5%, the top corporate tax rate would still be lower than it was during the pre-Trump era.
Rather than signaling the end of a cycle, high equity valuations are likely to keep forward returns muted.
- The price of the S&P 500 relative to 12-month forward estimated earnings is currently about 21x, a high level on any historical measure, even rivaling levels last seen during the Technology boom in 2000.
- In a yield-starved world, stocks actually look attractive relative to bonds. Over half of the constituents in the S&P 500 have dividend yields above the 10-year Treasury yield.
As we consider what’s next for equity markets, history may prove a useful guide. Past crises have shown that it can take some time to feel the full effects of massive government stimulus programs, and those effects tend to last for some time. Thus, while high valuations are certainly a cautionary sign and could weigh on near-term equity returns, monetary and fiscal stimulus combined with strong corporate profit margins provide tailwinds.
The opinions expressed in this commentary are those of the author and may not necessarily reflect those held by Kestra Advisor Services Holdings C, Inc., d/b/a Kestra Holdings, and its subsidiaries, including, but not limited to, Kestra Advisory Services, LLC, Kestra Investment Services, LLC, Bluespring Wealth Partners, LLC, and Grove Point Financial, LLC. The material is for informational purposes only. It represents an assessment of the market environment at a specific point in time and is not intended to be a forecast of future events, or a guarantee of future results. It is not guaranteed by any entity for accuracy, does not purport to be complete and is not intended to be used as a primary basis for investment decisions. It should also not be construed as advice meeting the particular investment needs of any investor. Neither the information presented nor any opinion expressed constitutes a solicitation for the purchase or sale of any security. This material was created to provide accurate and reliable information on the subjects covered but should not be regarded as a complete analysis of these subjects. It is not intended to provide specific legal, tax or other professional advice. The services of an appropriate professional should be sought regarding your individual situation. Kestra Advisor Services Holdings C, Inc., d/b/a Kestra Holdings, and its subsidiaries, including, but not limited to, Kestra Advisory Services, LLC, Kestra Investment Services, LLC, Bluespring Wealth Partners, LLC, and Grove Point Financial, LLC. Does not offer tax or legal advice.